David
Hardage
Analytics engineer. I build data pipelines and the visualizations on top of them.
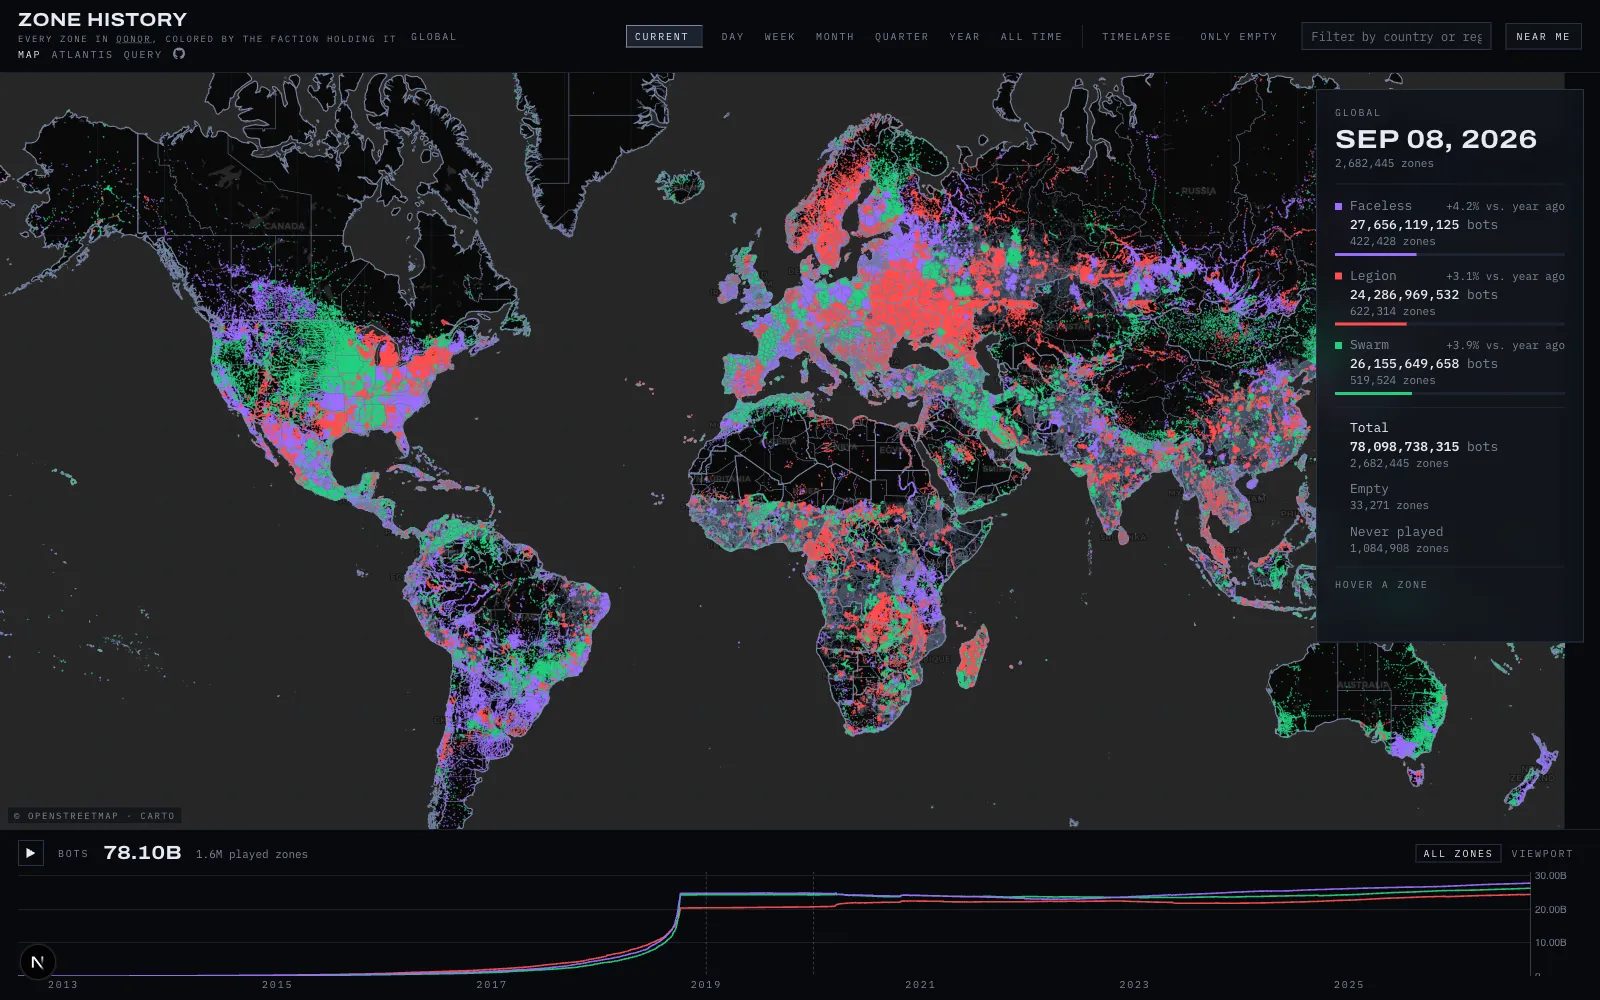
Zone History
Mapping fourteen years of events.
All 2.68 million zones from the mobile game QONQR, visualized across 14 years and counting. Served as Parquet with DuckDB in the browser, plus a query page for self-service analysis.
- 13.7B cells made linear
- Queryable Parquet marts
Python · polars · DuckDB · dbt · Next.js · deck.gl · Cloudflare
Open znhstry.com ↗cinemetrics
Eight years of film-watching, end to end
A full analytics pipeline over my own Letterboxd history. Data is enriched from the TMDB and OMDb APIs and modeled in DuckDB with dbt. The result is a static, cross-filtered dashboard with an ML recommendation engine, built with CI and served in your browser.
- Cross-filtered charts with shareable URLs
- Daily retrain and redeploy via GitHub Actions
Python · dbt · DuckDB · scikit-learn · Next.js · D3 · Cloudflare R2
Open cinemetrics ↗Other Projects
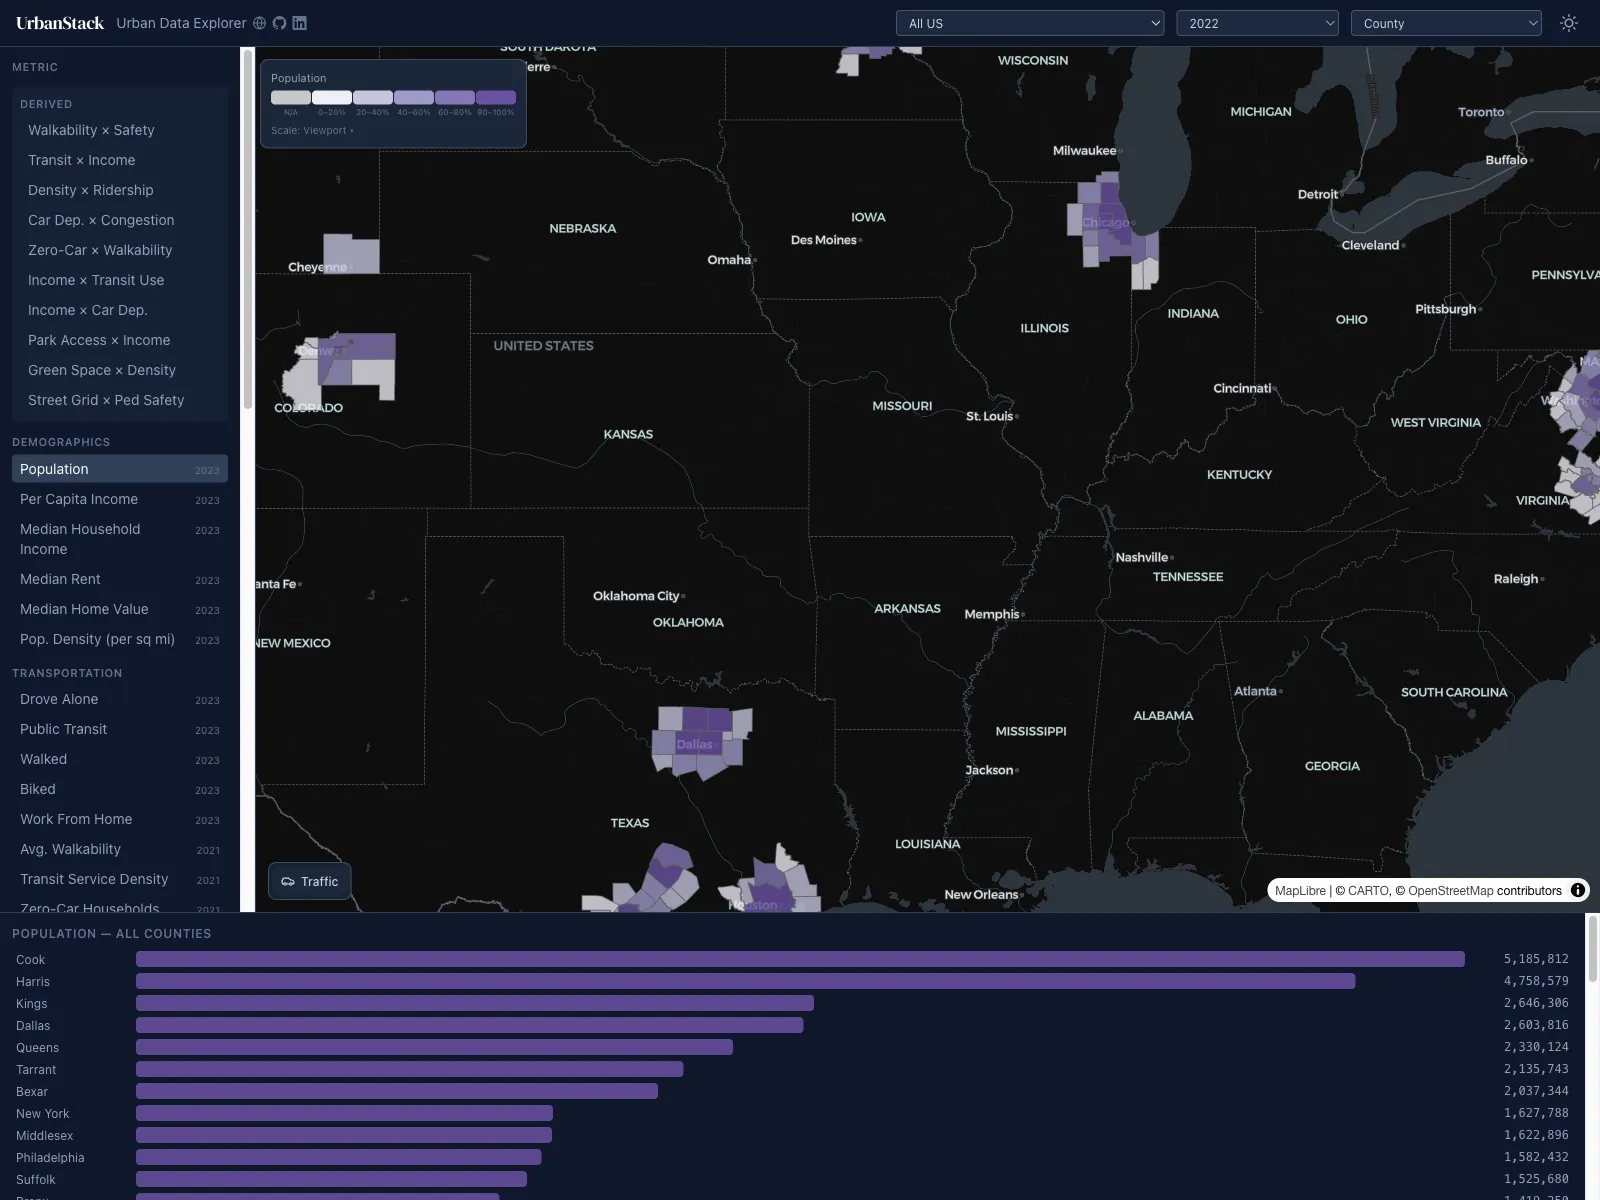
UrbanStack
Multi-layer urban data platform combining transportation, infrastructure, walkability, and demographic data for major US cities.
Next.js · deck.gl · DuckDB
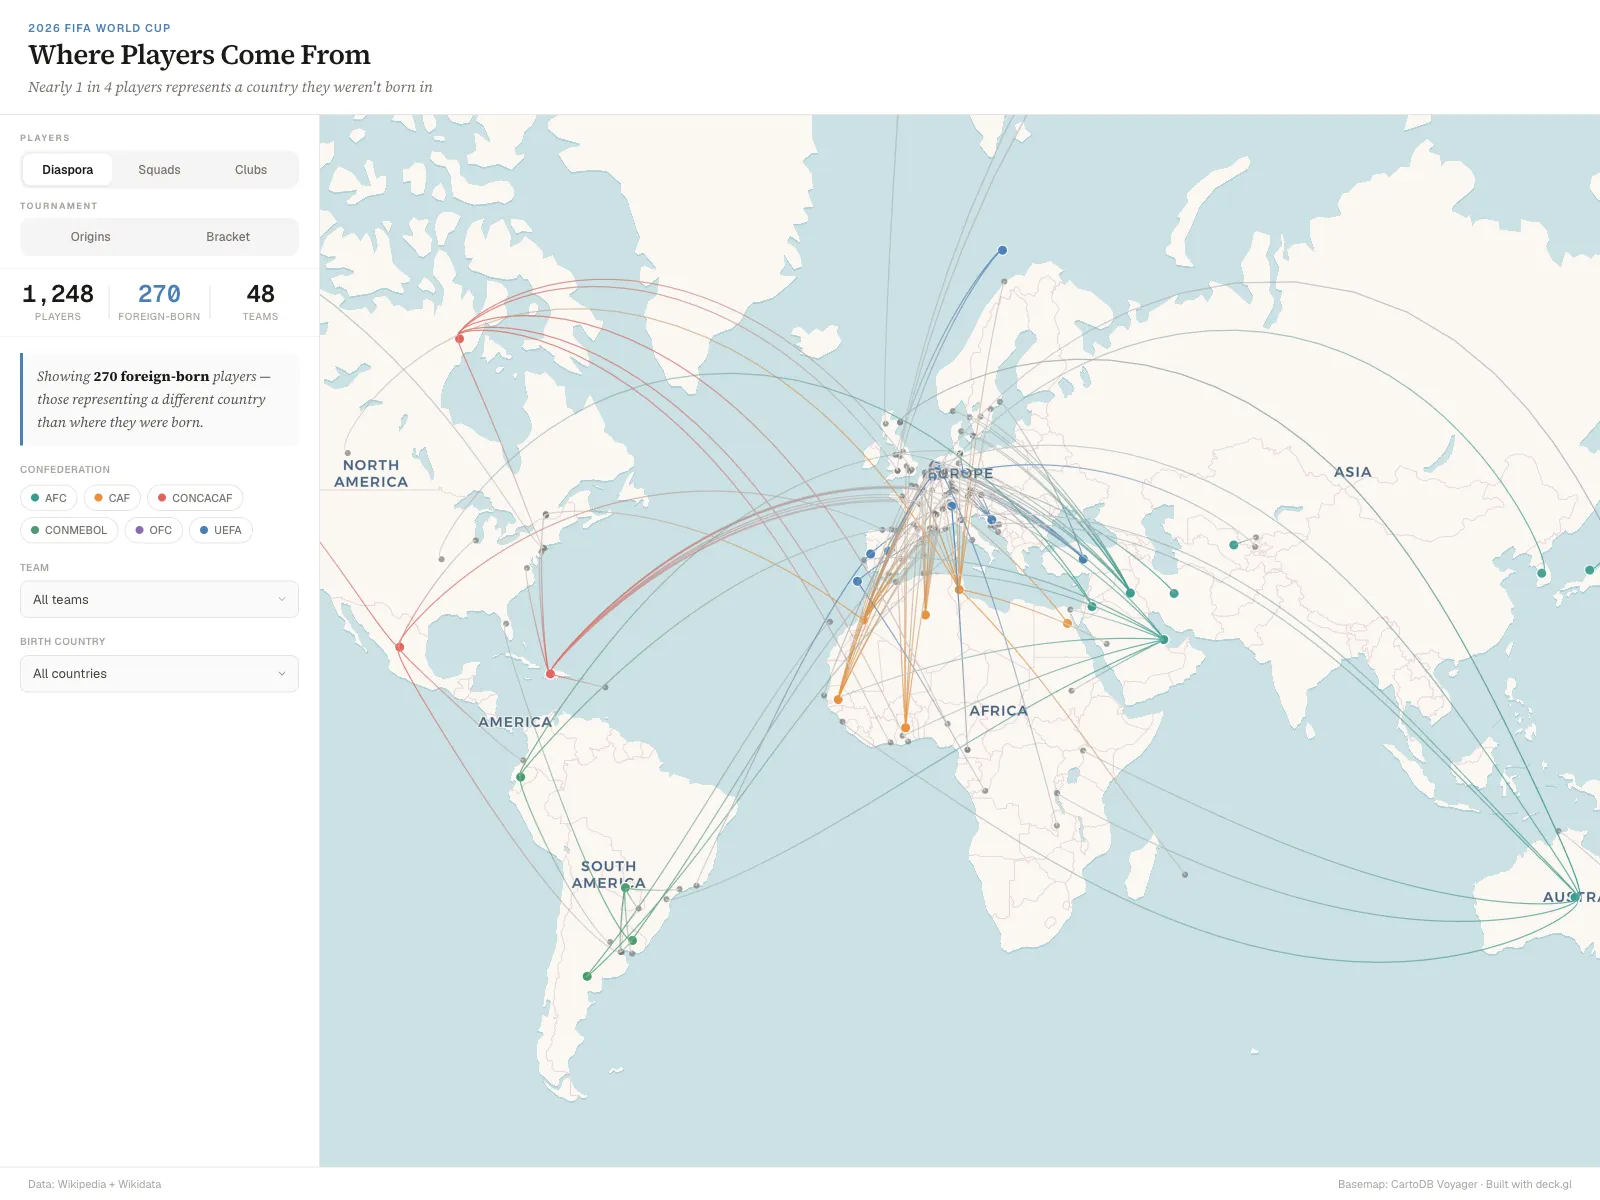
World Cup 2026
Interactive map exploring where every player was born versus which national team they represent.
Next.js · deck.gl · MapLibre
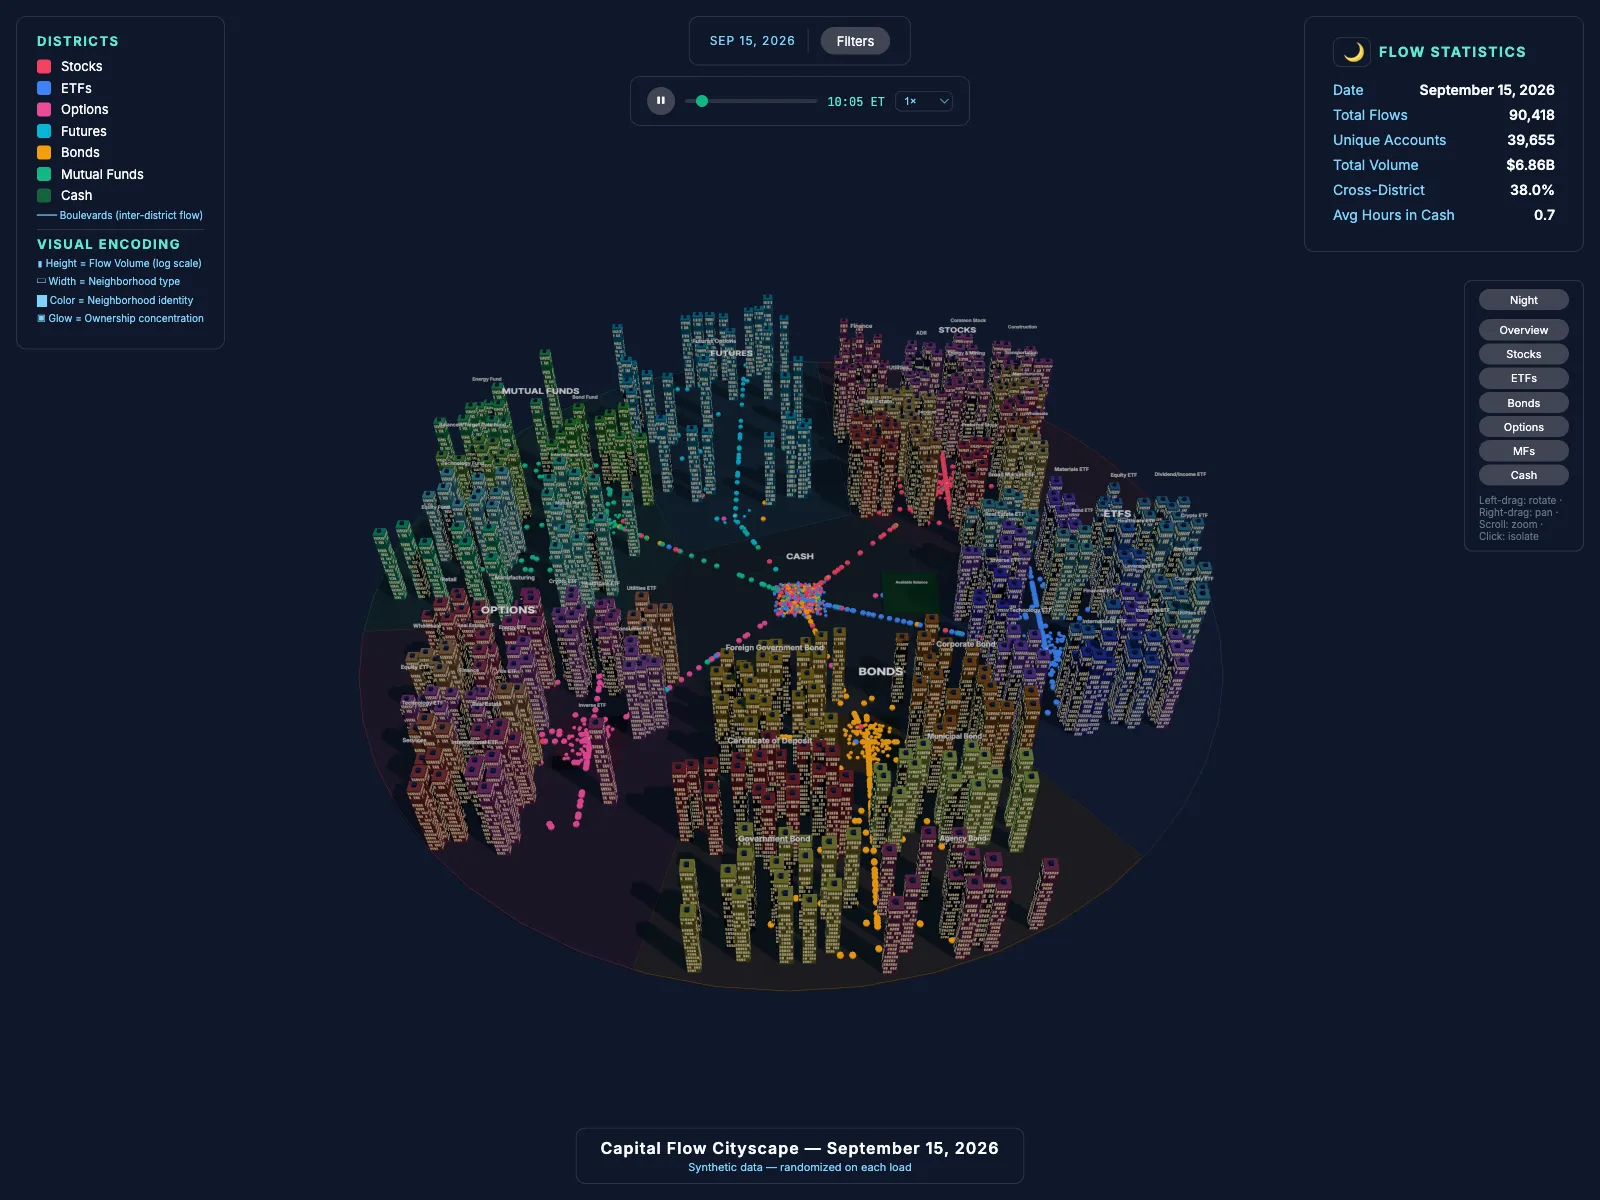
Capital Flow Cityscape
A 3D cityscape where buildings represent financial securities and capital flows become visible paths through a living city. Unique city every page load.
Three.js · Procedural Generation
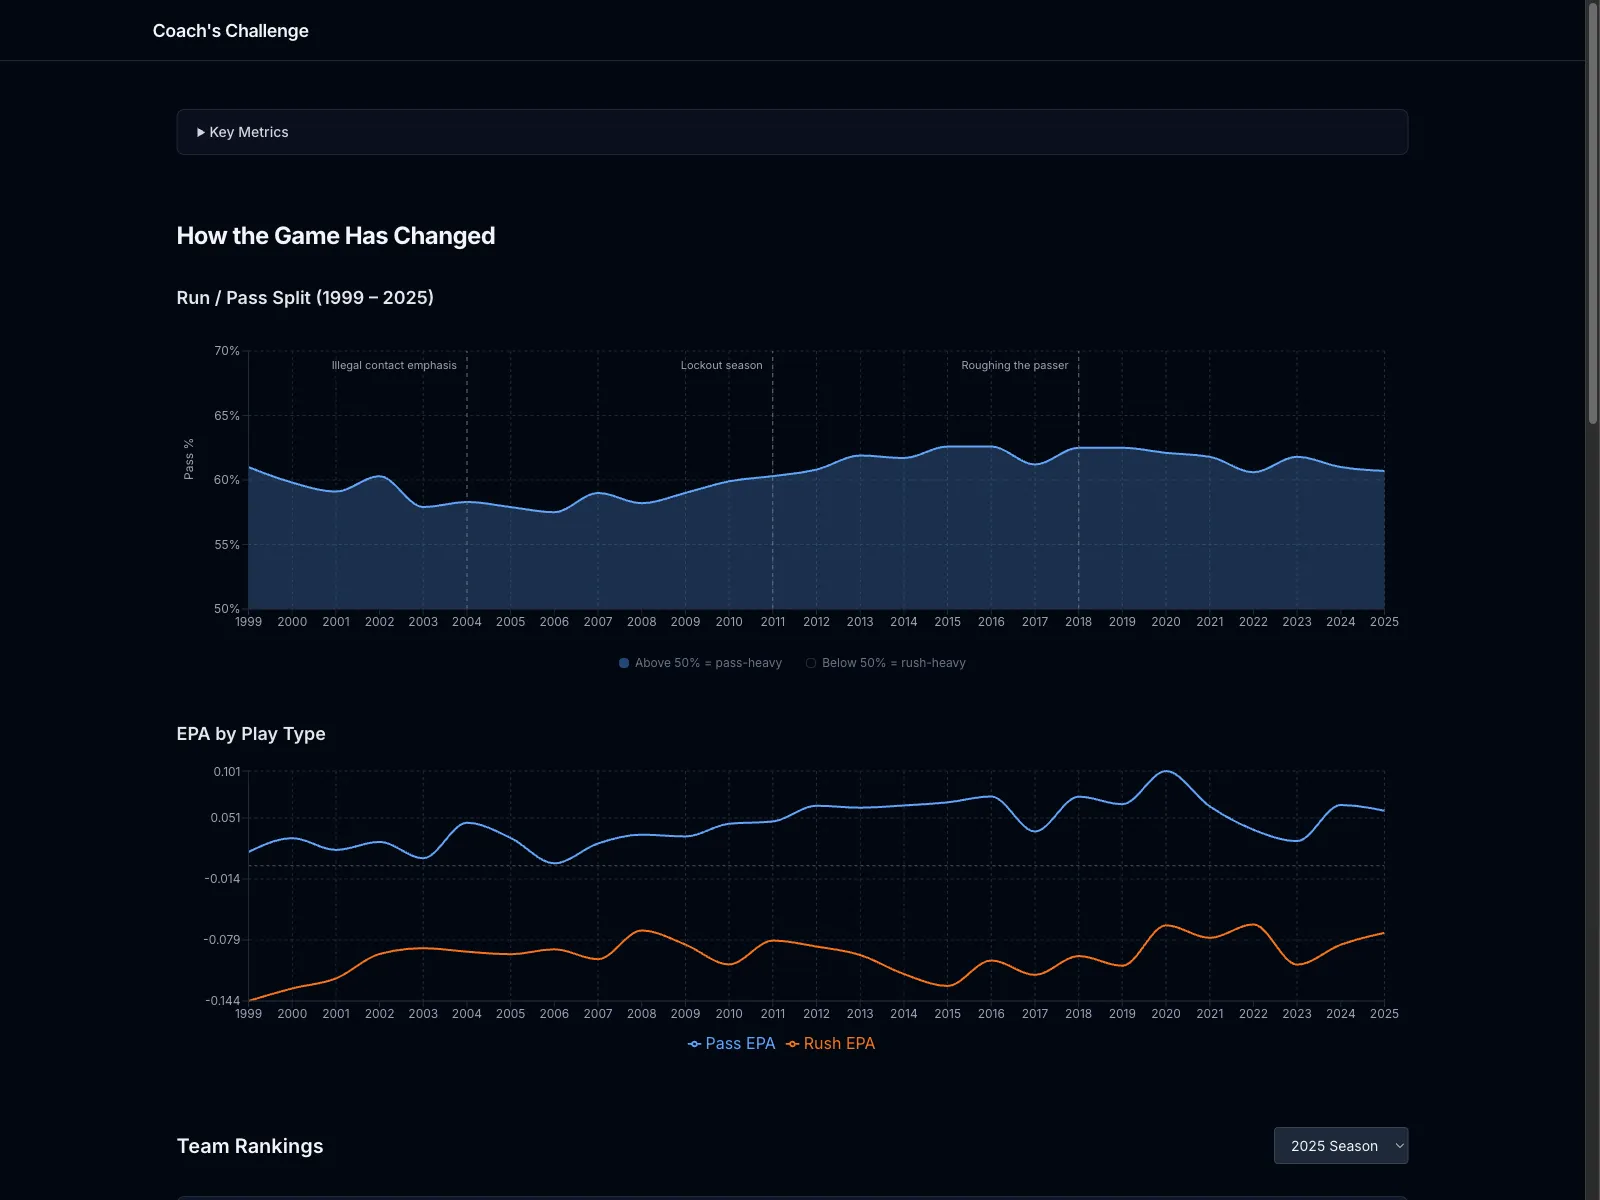
Coach's Challenge
NFL coaching decision quality analyzer that grades play-calling against 27 years of EPA-optimal baselines.
Next.js · Recharts · DuckDB
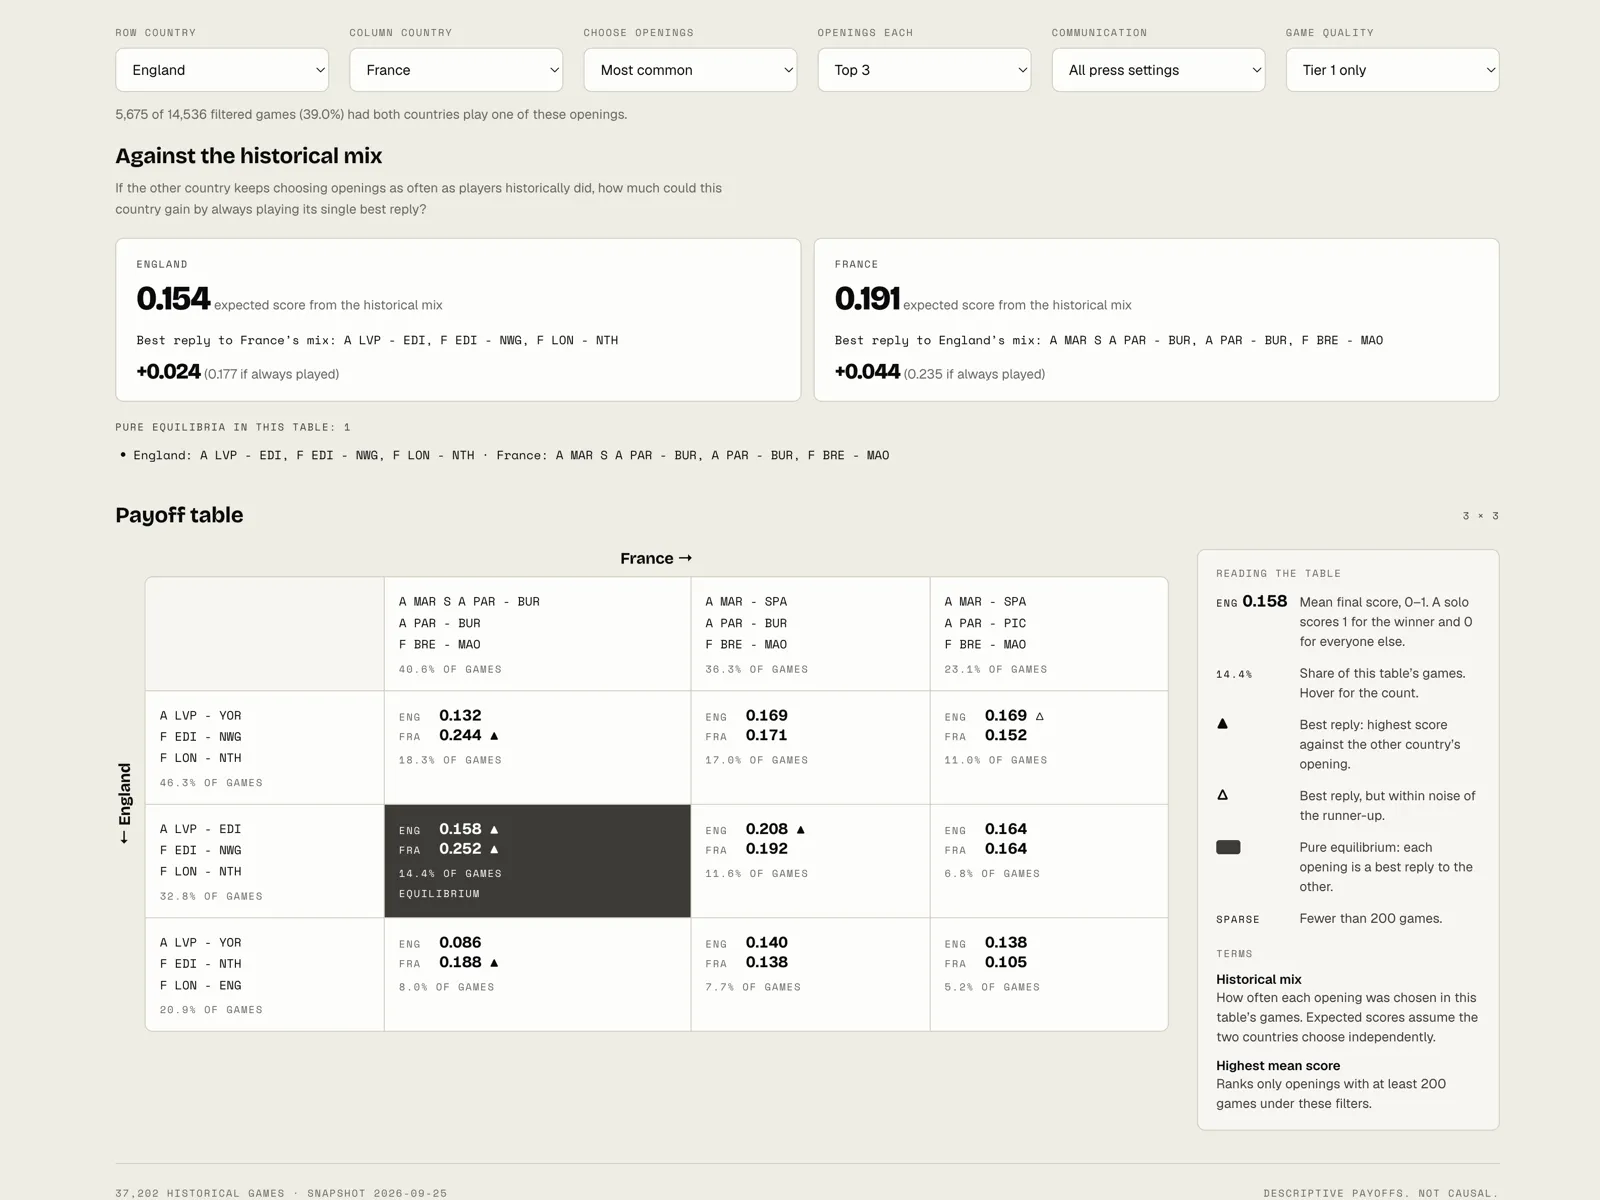
Diplomacy Lab
What happens after an opening, across 37,202 online Diplomacy games: an exact-match opening explorer and opening matchups analyzed as two-player games.
Python · polars · Vanilla JS · Game theory
I also give casual talks to friends and colleagues on whatever I'm thinking about at the time.